Causal Inference at Onfido
How Onfido's data science team built a Structural Causal Model of their document verification pipeline — and used it to simulate the impact of product improvements before shipping a single line of new code.


At Onfido, we use AI to automate digital identity verification for 800+ businesses worldwide. Our proprietary AI engine combines machine learning models to automate as many verifications as possible and escalate edge cases for human review.
In this post, I’ll walk through how we used Causal Inference to create a structural model of our document verification product, and how that model lets us simulate the impact of product improvements before building anything.
Automation Structural Causal Model
We needed to create a model that would provide a high-level overview of our document verification product and allow us to evaluate the causal effect of product initiatives on automation.
We turned to Causal Inference because it aims at answering causal questions and estimating causal effects. Structural Causal Models (SCMs) represent causal relationships between variables using a directed acyclic graph (DAG) and structural equations.
We started with creating a graph of the document verification product. From the point a document is submitted until a decision is made, we mapped every step and its inputs.
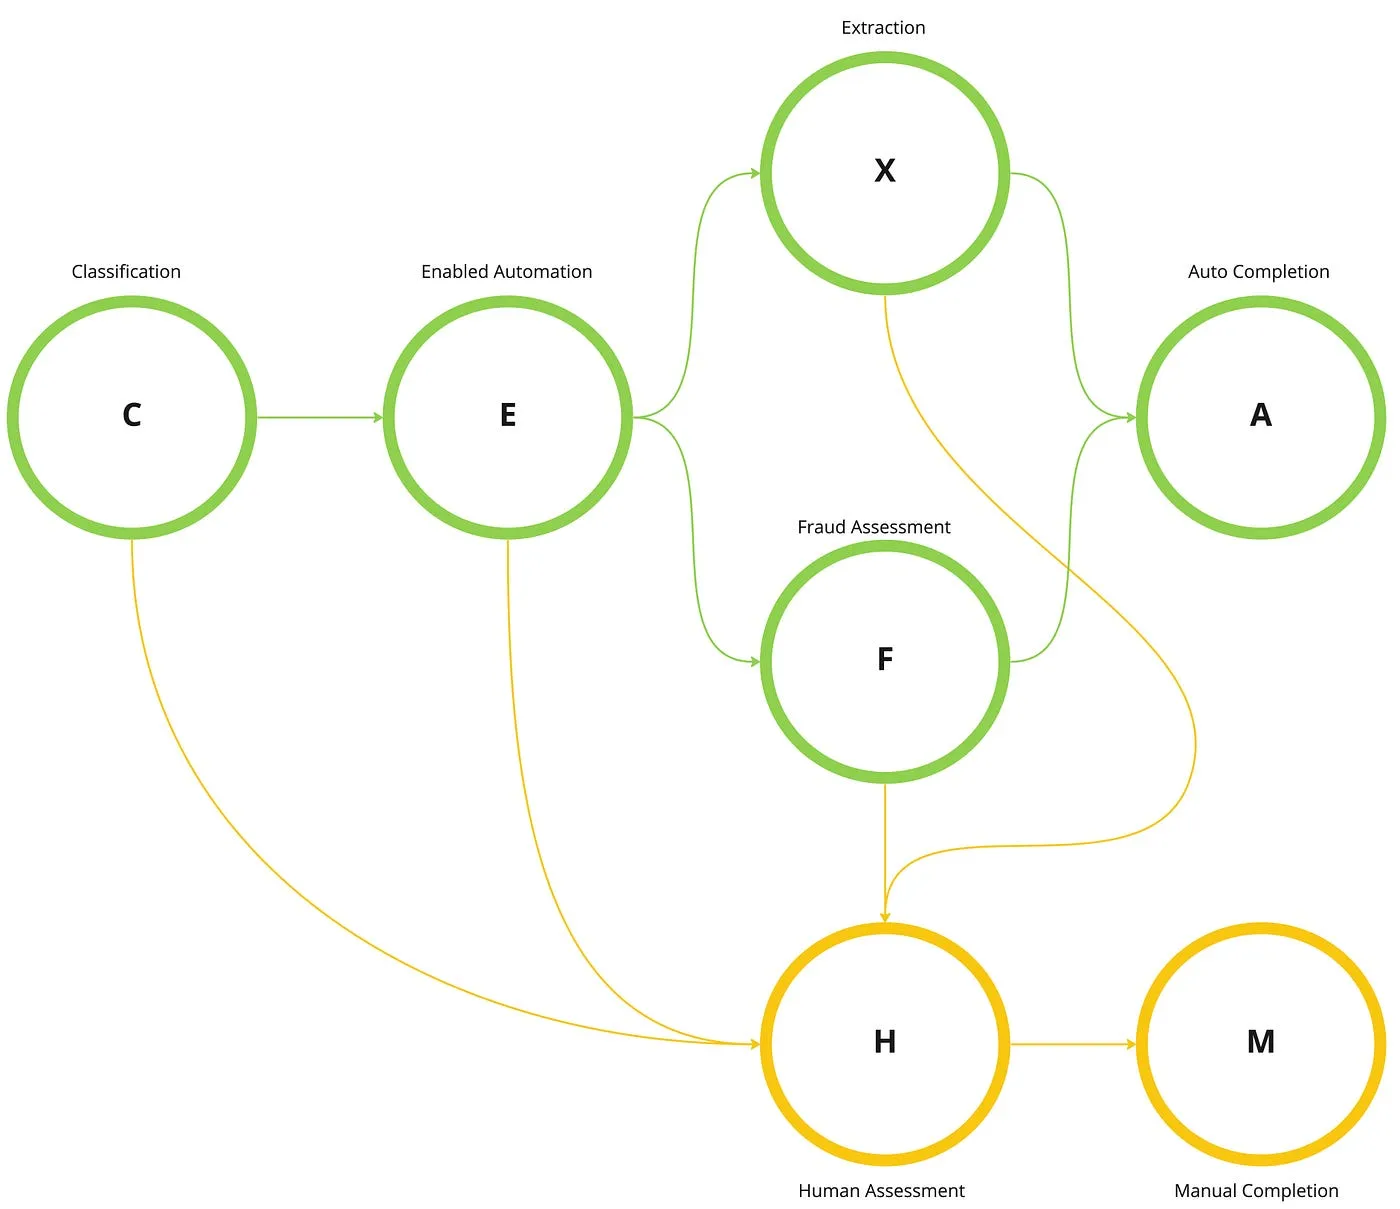
The graph has two main flows: automated (Onfido’s AI) in green and manual (human agents) in amber. The product automation rate is the share of checks that go through the automated flow.
Formally, a causal graph specifies a factorisation of the joint probability distribution of data:

The next step was to formalise the relationship between variables. Let N be the number of checks submitted for a period of time. We introduced the following notation:

We used simple regression models without additive error terms for the modelling. Structural equations provide the functional relationship between each variable and its direct causes:

For this article, we’ll generate a synthetic dataset and use the automation structural causal model to evaluate product initiatives.
list_country_names = [country.name for country in pycountry.countries]
document_types = ['ID', 'Passport', 'Driver Licence']
documents = list(itertools.product(list_country_names, document_types))
We’ll generate all the variables randomly and obtain a dataset, in which one line corresponds to one document type per country:
np.random.seed(0)
df = pd.DataFrame(data=documents, columns=['Document'])
df['Classification rate'] = np.random.uniform(0, 1, len(df))
df['Enabled automation'] = np.random.randint(0, 2, len(df))
df['Extraction rate'] = np.random.uniform(0, 1, len(df))
df['Non-Fraud rate'] = np.random.uniform(0, 1, len(df))
df['Share of checks'] = np.random.dirichlet(np.ones(len(df)))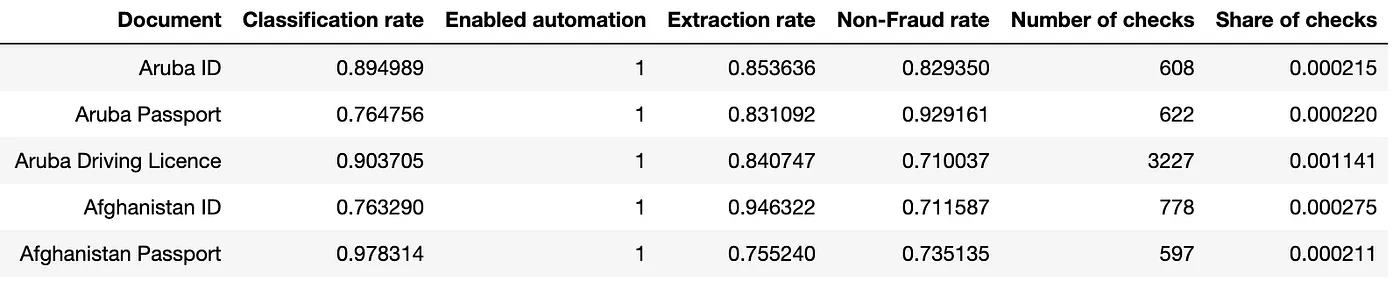
Classification

After an applicant submits a picture of their document, Onfido’s AI will try to classify it: determine the issuing country and document type. Classification is characterised by a score that represents the model’s confidence level.
If the classification score is higher than a threshold, this document will continue in the automated flow; otherwise it will be escalated for manual review.
N = 100
df_c = df[df['Classification rate'] >= 0.2]
c = df_c['Share of checks'].sum()
classified = c * N
Enabled automation
To decrease the number of fraudulent applicants who pass our verification process, Onfido doesn’t allow some document types or countries to be processed automatically.
e × c × N checks continue the automatic flow. In the code, we’ll take the checks that passed classification and filter for those with enabled automation:
df_e = df_c[df_c['Enabled automation'] == 1]
e = df_e['Share of checks'].sum()
enabled_auto = e * c * N
Engine
The engine is simplified into two components that are executed simultaneously. Extraction refers to an ensemble of machine learning models for extracting information from the document image.
Fraud assessment refers to determining whether the document shows signs of fraud. Our unique micro-model architecture allows us to detect different types of fraud by running many specialised models.
Let a be the share of checks that pass both components.
Auto-complete
Document verifications that passed both auto extraction and auto fraud assessment are auto-complete.
df_a = df_x[(df_x['Extraction rate'] >= 0.7) & (df_x['Non-Fraud rate'] >= 0.8)]
a = df_a['Share of checks'].sum()
auto_complete = c * e * a * N
39% of all checks are auto-complete.
A Simple Intervention
One of the benefits of causal inference is that it allows us to simulate experiments and evaluate the causal effect of interventions.
The do-operator is used in causal inference to denote an intervention. Given random variables A and B:
- P(A | B) is the probability of A given B (the distribution under a natural state of B)
- P(A | do(B = b)) is the probability of A given an intervention that sets B to b
The do-operator simulates interventions by deleting certain functions from the model, replacing them with a constant value. Formally:
We can simulate an intervention in Extraction by removing an incoming arrow from E to X, and manually setting the extraction rate to a fixed value x₀ for the documents we’re interested in:
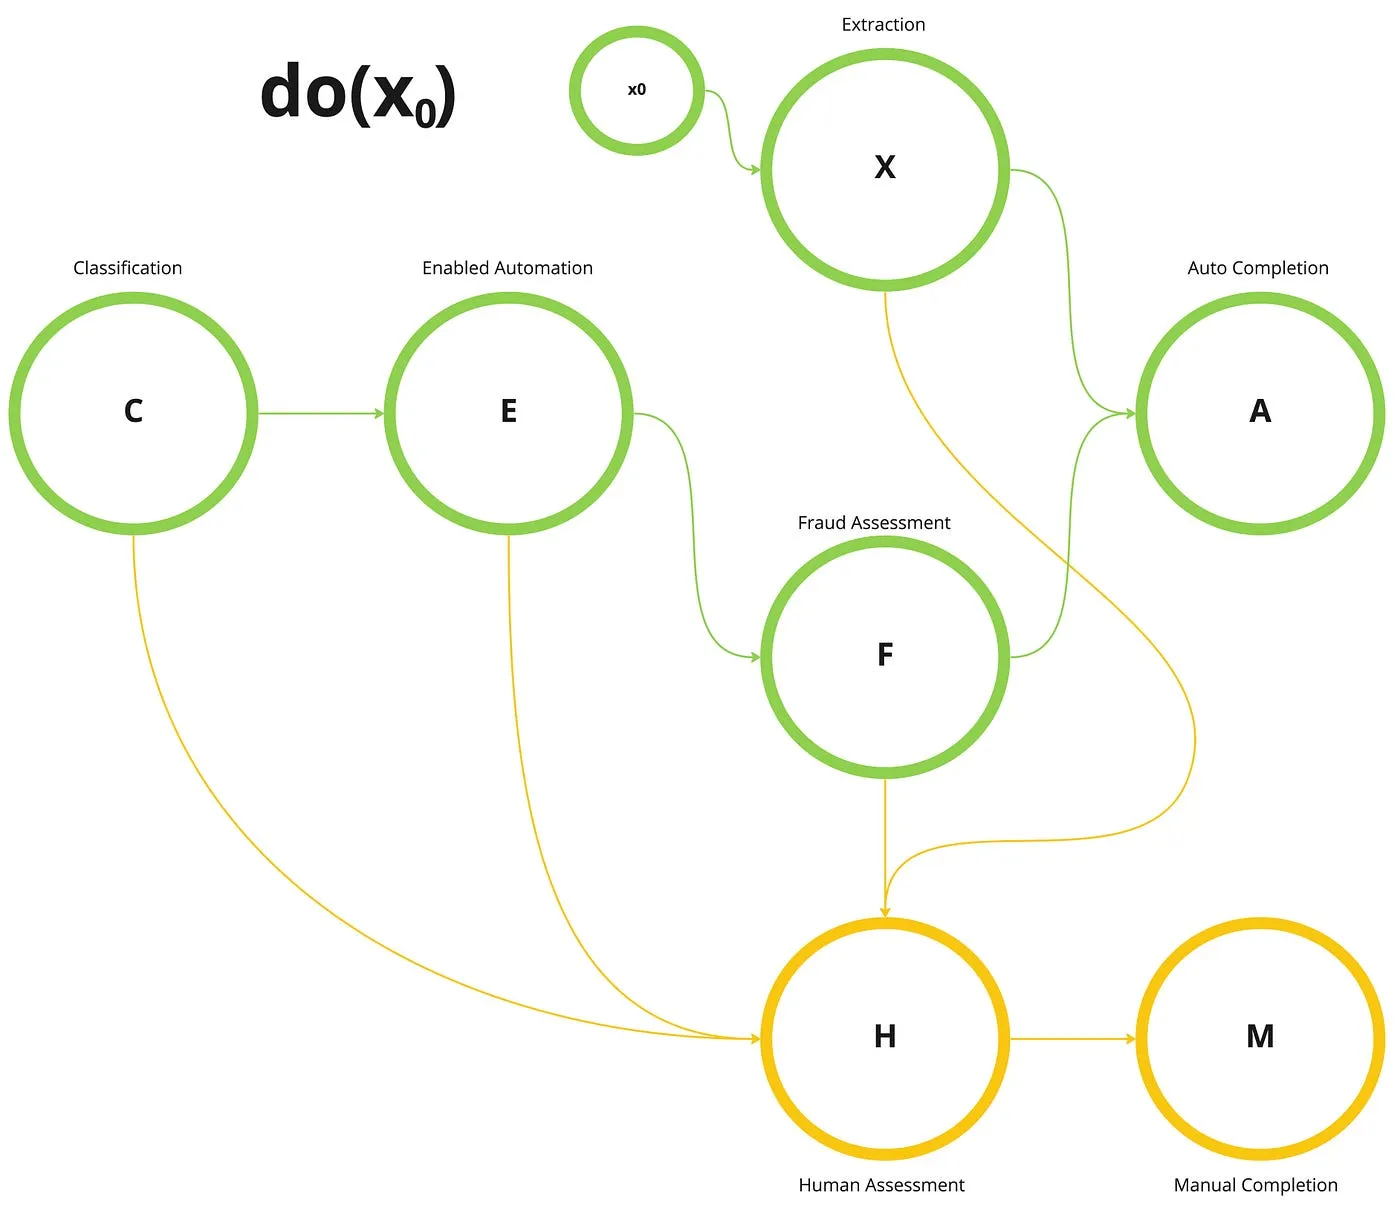

The new auto-completion rate is:

Where a₀ is the percentage of checks that pass both Extraction and Fraud Assessment. The uplift from this intervention is:

Example
One of the product initiatives is improving the extraction model’s performance up to 99% on the top three document types for a set of countries — the “-stans”:
stans = ['Turkmenistan', 'Uzbekistan', 'Tajikistan', 'Kyrgyzstan',
         'Kazakhstan', 'Afghanistan', 'Pakistan']
df_a0 = df_e[df_e['Document'].apply(lambda x: any(s in x[0] for s in stans))]
We’ll set the Extraction rate to x₀ = 0.99 and calculate the uplift:
df_a0.loc[:, 'Extraction rate'] = 0.99
a0 = df_a0['Share of checks'].sum()
uplift = c * e * a0 * N - auto_complete
The uplift from optimising extraction on the top 5 documents is 0.6 percentage points.
Extraction Optimisation
Going even further, instead of taking a set of top three documents, we can estimate the uplift of improving extraction on different subsets of document types, ordered by volume.
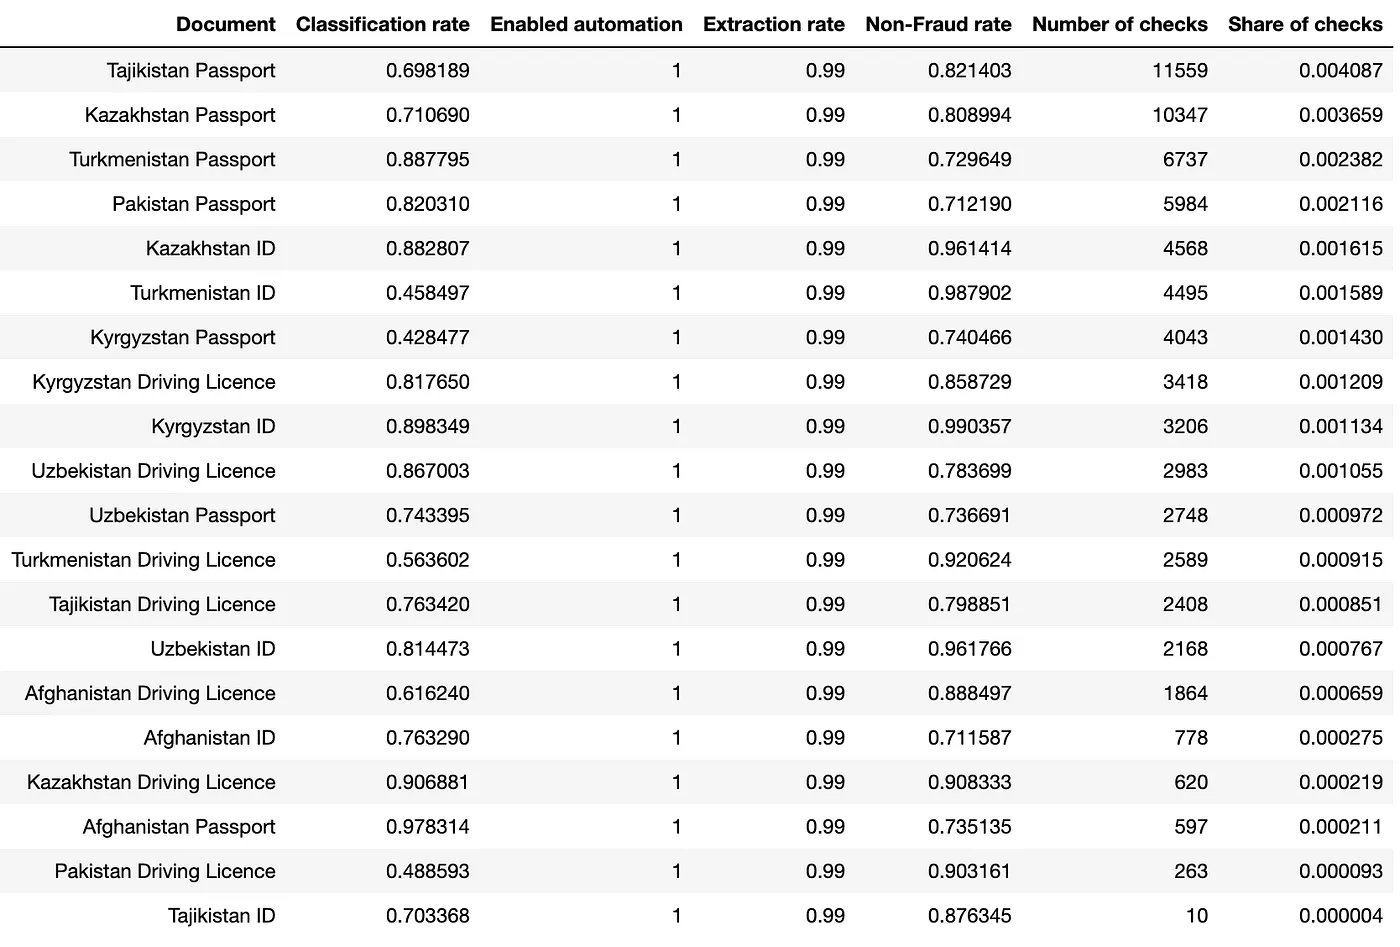
The first document in the subset has the highest volume in checks and the n-th has the lowest. According to the law of diminishing returns, each additional document type has a smaller marginal uplift.
Kneedle
The Kneedle algorithm is an algorithm developed to detect knees in discrete datasets. We’ve used it to detect the knee of the uplift curve — the optimal subset of document types to prioritise.
This algorithm uses the mathematical definition of curvature for a continuous function as the basis for the knee point:

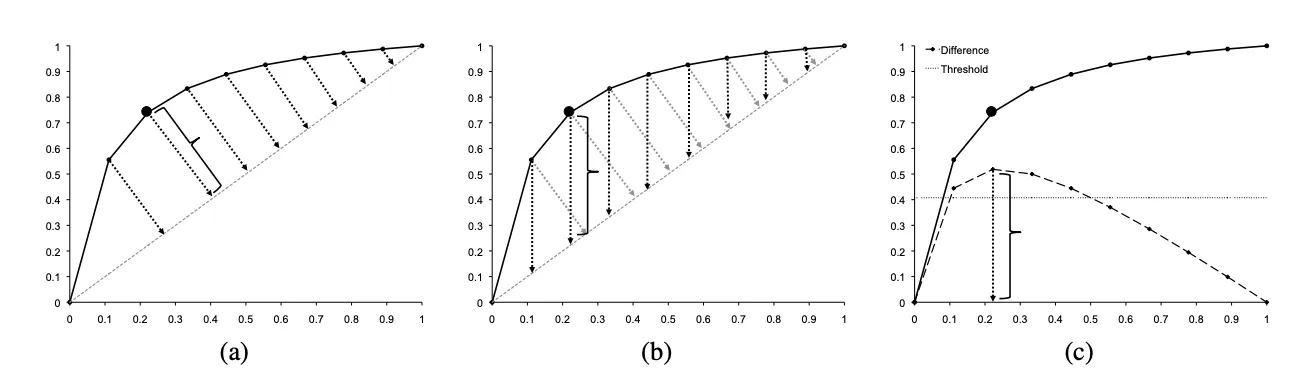
The algorithm follows these steps:
a) We use a smoothing spline to preserve the shape of the original dataset as much as possible. The points of the spline are normalised between 0 and 1.
b) The distances are rotated 45 degrees clockwise. The goal is to determine when the difference curve changes significantly.
c) We find the local maxima of the difference curve. For each local maximum, we define a unique threshold value. The knee is the first local maximum that exceeds its threshold.
Optimising Extraction rate with Kneedle
We’ll use the kneed Python package’s implementation of the algorithm and the automation model’s formula to calculate the optimal number of document types to optimise:

Plotting the uplift for every document type i, we obtain this graph with the number of document types to optimise on the x-axis:
uplift = []
df_xn = df_xn[(df_xn['Extraction rate'] >= 0.7) & (df_xn['Non-Fraud rate'] >= 0.8)]
for i in range(1, len(df_xn) + 1):
    df_top = df_xn.head(i)
    df_top.loc[:, 'Extraction rate'] = 0.99
    a0 = df_top['Share of checks'].sum()
    uplift.append(c * e * a0 * N - auto_complete)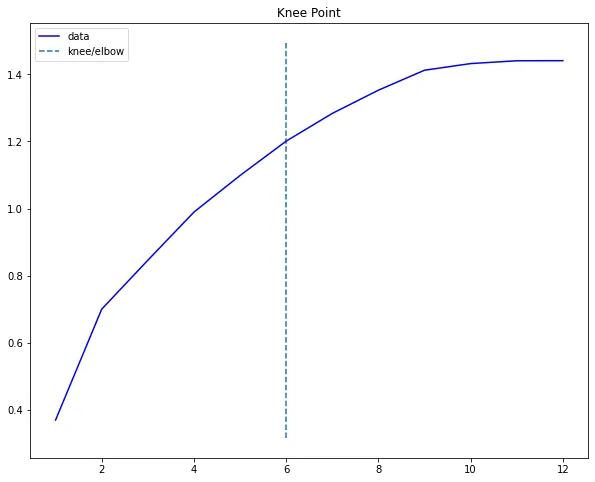
The knee point is at top six document types, corresponding to an uplift of about 1.2 percentage points. Improving extraction on more than six document types yields diminishing returns.
Conclusion
Using causal inference we’ve created a high-level overview of Onfido’s document verification product. It allows us to understand the causal effects of variables on automation and simulate interventions.
The model we created allowed us to simulate the potential impact of varying product initiatives on automation rate. Combined with the Kneedle algorithm, we can identify the optimal subset of documents to focus extraction improvements on — giving product and engineering teams a principled way to prioritise before writing any code.

Resources

Hook this up to your favourite commenting platform — Giscus, Disqus, or your own.
Continue reading
Data-driven Product Launch — Onfido Studio
How a data scientist approaches a B2B product launch from first principles — defining metrics before a line of code ships, building the data model, creating pre-launch dashboards, and learning from the first beta customers.

How to Start with Chaos Engineering Experiments?
Chaos engineering experiments can be highly exploratory at the beginning. Here are the six acceptance criteria you need to define before you inject a single fault.

Co-Developing Products: A Deep Dive Into Customer Insights
Co-development means companies create products with their customers and users. Explore the benefits and three layers of customer insight.